
Among the data and metrics available to you, Leadtime Analytics stands out as a powerful tool in Revenue Management and Marketing. When you understand at a detailed level the period between when a booking is made and the guests check in across all the different dimensions such as Segment, Channel, Country, Promotion, and more, you can develop more effective pricing strategies, improve forecasting accuracy and also the overall performance of the hotel.
What is Leadtime Analytics
Leadtime, or the booking window, is the number of days between when a guest makes a reservation and their arrival date at the hotel. Leadtime Analytics includes the collection, analysis and interpretation of this data to uncover patterns and trends in this booking behavior.
Examining Leadtime helps you understand the booking habits of different segments, the impact of different channels, influence of seasonal changes as well related to different origin markets.
Why You Should Use Leadtime Analytics
The main benefits of leveraging Leadtime Analytics can be found in the following areas:
- Better demand forecasting: If you understand the leadtime patterns and trends well you will be able to forecast future booking trends with greater accuracy.
- Improved revenue management: Better assessments of demand enable you to more effectively adjust inventory, pricing and restrictions to maximize performance.
- Target Marketing campaigns more effectively: With insights from Leadtime Analytics you will understand not just leadtime patterns at large but in great detail across any filtered combination of dimensions. This means you can activate promotions at times when certain segments are more likely to look and book, increasing the impact of the campaign.
- Optimized pricing strategies: By digging deeper into booking behavior including leadtime data, you will be able to more effectively set rates and restrictions for example for your early booking campaigns and also last-minute rates.
How You Should Use Leadtime Analytics
There are different levels of leadtime that you want to analyze to get to a solid understanding of the booking patterns and trends:
- Average leadtime: Average leadtime is a tricky and somewhat dangerous KPI and needs to be carefully configured for the use-case to which you are applying it.
The risk sits in the fact that average leadtime is built up out of many bookings with shorter and longer leadtimes. So for example an average leadtime of 25 days might result from 50% same-day bookings and 50% of bookings made 50 days before arrival. While the average leadtime is 25 days there are actually no bookings made 25 days before arrival.
As such, average leadtime should only be used to assess trends: is the leadtime getting shorter/longer?
It should specifically not be used to target promotions or forecast demand. - Most booked leadtime: This is a useful KPI in addition to average leadtime to provide the latter with context on how accurate the average leadtime is and where the weight of leadtime distribution sits.
- Leadtime distribution: The most effective visualization to monitor to truly understand leadtime is through a leadtime distribution graph. This graph shows you how leadtime of bookings is distributed along a timeline, and highlights clearly where the weight(s) of bookings is/are concentrated. An example of a Leadtime Distribution Graph is shown below. You can clearly see how and where bookings are being made.
This visualization becomes much more powerful when the bookings included are filtered across any number of dimensions (segment, channel, country, company, agency, etc.) to determine the leadtime pattern of a specific audience.
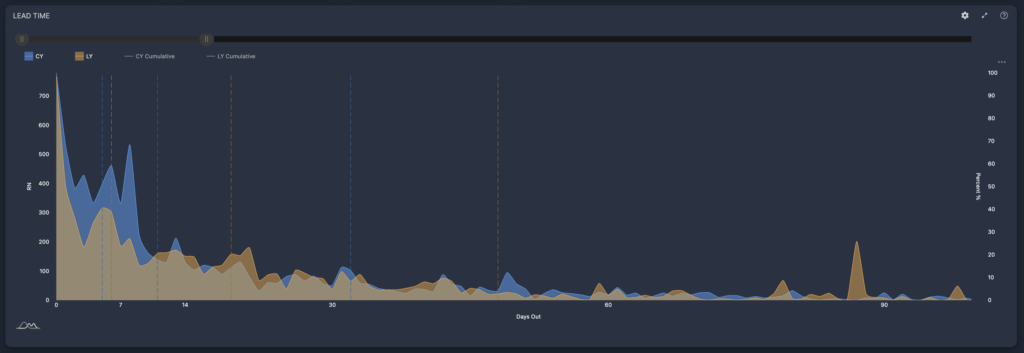
Image: Leadtime Distribution Graph showing booking volume by leadtime, the vertical dotted lines show when 25-50-75% of final business-on-the-books was achieved, also cumulative lines can be added
- Leadtime for moment of booking: Analyze leadtime for bookings made during a particular period to understand what stay periods are most impacted during which booking period.
- Leadtime for moment of stay: Analyze leadtime for bookings staying in a particular period to understand when the time window is that this stay period is most impacted by bookings.
What Are the Key Metrics in Leadtime Analytics?
Are you just getting started with data and analytics? Check out this checklist by Juyo Analytics to set yourself up for success.
Here are a couple of ways to start using Leadtime Analytics immediately, whether you are using your own exports and for example MS Excel or a comprehensive Business Intelligence solution to get to the data faster.
- Monitoring Leadtime and Leadtime trends: Focus on your key segments, channels and countries and monitor the Average Leadtime and the Most Booked Leadtime on a monthly basis to identify any changes in the familiar patterns and trends.
- Identifying seasonal leadtime trends and changes: Every month, for the month gone past as stay period and as booking period analyze the leadtime distribution as a whole and for key segments, channels and countries (potentially also other dimensions that are important to your hotel such as a key corporate account). This will help you understand across the year what leadtime variations exist and which of your business drivers exhibit which behavior.
- On a weekly basis, or when you are updating your forecast, check for any leadtime outliers since the previous forecast to see where you may need to make an adjustment when business picked up more or less than anticipated.
What Is the Outcome of Using Leadtime Analytics?
When you understand the dynamics in leadtime as they are exhibiting across your business you will find that your hotel’s performance becomes easier to predict and more resilient to change because you know better how to adapt your strategies and tactics across Revenue Management and Marketing.
Particularly by understanding leadtime patterns across your highest-producing segments, channels, countries and other relevant dimensions will have impact on how much in control of your hotel’s performance you are.
Whenever a gap in future performance pops up, for example due to a softer-than-expected market or because of the loss of group business – understanding leadtime will point you immediately in the right direction to try to fill the gap.
Finally, leadtime analytics is a great way to understand how well you are tracking against budget and forecast and how realistic it is that you will achieve them.
What Could a Starting Point for a Leadtime Analytics Dashboard Look Like?
Building a functional Leadtime Analytics dashboard is not just about displaying the right data but also about showing the right dimensions to be able to filter and cross-filter by them.
For a starting point you could include the following:
- High-level business KPI’s (such as On-The-Books) to see the scale to which the leadtime analytics applies
- Average Leadtime: to evaluate the average leadtime of the filtered business
- Most-booked Leadtime: to see where the highest concentration of bookings sits in terms of leadtime
- Leadtime Distribution Graph: this is where you can see the leadtime pattern for the filtered business, your key visualization in this dashboard.
- Explorations (breakdowns) to show you the leadtime elements by which you want to filter along with their average leadtime and revenue production (to assess scale). You should choose the dimensions that are most relevant to your business, in this example you find the following selection: Segments, Channels, Countries and the behavioral dimensions Length of Stay, Days of Week and Occupancy Bands.
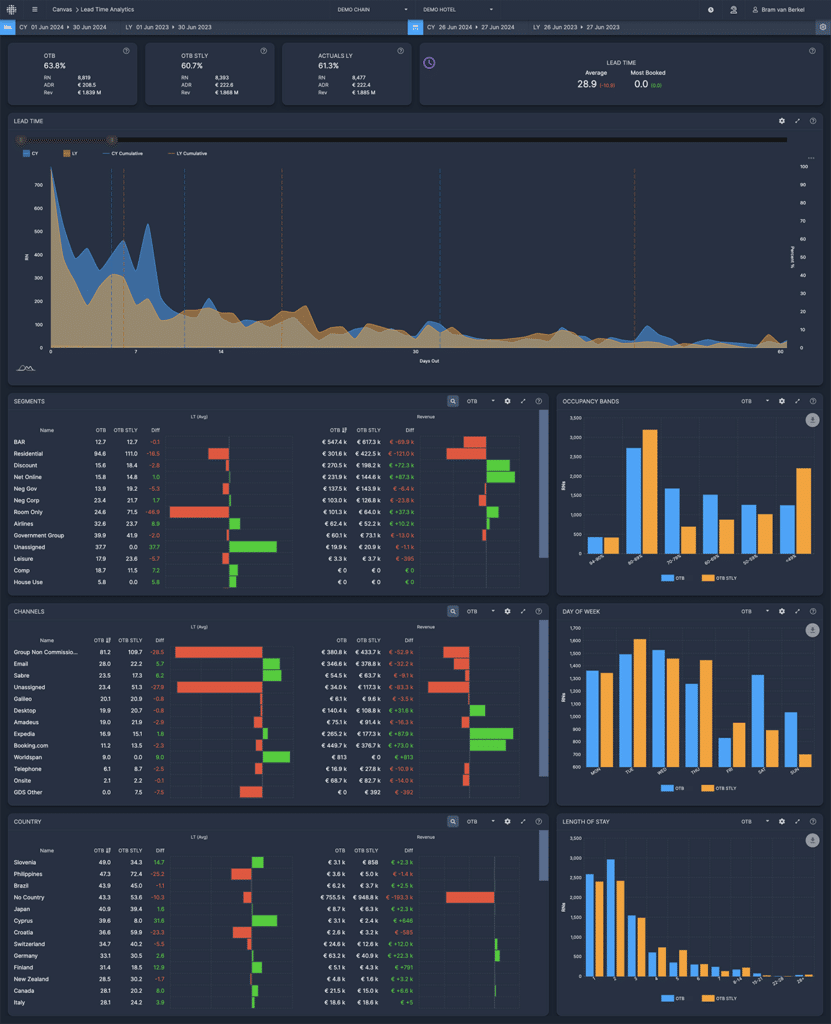
Image: Sample Leadtime Analytics dashboard
Leadtime Analytics is a vital tool to ensure forecasting accuracy, anticipate changes in trends and demand, take action in case of unexpected up- or downturn and guide overall revenue and marketing strategies. By understanding and leveraging booking windows, hotels can make informed decisions that drive profitability. Start making the most of Leadtime Analytics today to stay ahead in competitive environments.
Free Checklist: Start Using Data in Your Hotel’s Decision-Making
Using data to power insights and decisions at your Hotel can position you for commercial success, help increase guest satisfaction, and reduce costs. This checklist provides a starting point for hoteliers new to data analytics in the hotel industry.
Click here to download the checklist “Start Using Data in Your Hotel’s Decision-Making“.
More Tips to Grow Your Business
Revfine.com is the leading knowledge platform for the hospitality and travel industry. Professionals use our insights, strategies, and actionable tips to get inspired, optimize revenue, innovate processes, and improve customer experience.Explore expert advice on management, marketing, revenue management, operations, software, and technology in our dedicated Hotel, Hospitality, and Travel & Tourism categories.


Leave A Comment