

In hotel management, numbers are everywhere: dashboards, reports, presentations. These numbers offer a sense of control and clarity. But numbers on their own don’t tell the full story. Relying on isolated metrics can lead to misguided strategies, missed opportunities, and costly mistakes.
It’s the context that brings meaning to the numbers: in addition to the numbers as shown, is there something we don’t know that gives what we do know a different outcome or perspective?
Six Real-World Lessons in Hotel Analytics
Let’s explore six hotel scenarios where lack of context led to potentially incorrect conclusions, and what we can learn from them.
1. Booking Pace: A False Sense of Security
“We’re 5% ahead vs. same time last year!” That sounds like a win. But take a closer look: Last week, the hotel was 7% ahead. Two weeks ago, it was 10%. That’s a downward trend instead of growth.
Now let’s take another step and look at lead time. Bookings are coming in 10% closer to arrival compared to last year. So while the pace currently looks better, is it really? If demand is shifting to later bookings, a short-term pace lead could disappear fast.
Then, compare internal booking trends to external demand data. If the market is pacing 7% ahead and you’re only 5% up, you’re actually losing share.
The lesson: Look beyond year-on-year comparisons. Evaluate trends, lead time shifts, and market data together. Booking pace without context is just noise.
2. Acquisition Costs: The Profitability Trap
A hotel reports a 12% increase in revenue. Time to celebrate? Not so fast. Acquisition costs climbed 15% in the same period. The revenue growth is actually shrinking profit margins.
This is a classic trap: focusing on gross revenue instead of net revenue. Metrics like Average Daily Rate look great on the surface, but unless you strip out the cost to acquire each guest, you still don’t truly understand which guests are contributing to your financial performance the most or least.
Was the increase in acquisition cost due to a heavier reliance on higher-cost channels such as OTAs? Did marketing investments increase or experience a performance drop? Or was the channel mix poorly optimized? Without context, you won’t know.
The lesson: Top-line growth does not automatically mean success. Always consider customer acquisition costs and channel profitability. Context reveals where real value is coming from
3. Room Types: The Upgrade Illusion
A hotel is trying to analyze how different room types are performing. They check ADR in their PMS’s room type report and discover the Premium King Room has a lower rate than expected.
What if that room is frequently used to accommodate complimentary upgrades? Naturally, the ADR of the PMS report will show a lower amount because many guests paid for a lower category – it considers the rates paid by guests who STAYED in that room type, even if they had originally booked a different room type.
This is where looking at BOOKED ADR (what the guest originally paid for the room they reserved) can clear things up. Otherwise, pricing strategies for room types might be wrongly adjusted, thinking one room is underperforming when it’s actually doing just fine.
The lesson: Stayed ADR alone can be misleading. Differentiate between booked and stayed values, and factor in upsells and upgrades. Context keeps pricing strategy sharp.
4. Meetings & Events: The Illusion of Occupancy
A hotel sees a 20% increase in meeting room occupancy and thinks the events strategy is working well. But revenue hasn’t moved much.
Let’s look deeper. Were the events discounted heavily to drive volume? Were small gatherings taking up large rooms, leading to inefficient space usage? Was there an increase in non-revenue-generating internal events?
High occupancy isn’t always a win. A better metric here is RevPASM (Revenue per Available Square Meter) or even: profit per available square meter. These metrics reflect not just usage, but yield and profitability.
The lesson: Meeting room occupancy is just a small part of the picture. Efficiency and profitability per square meter matter more. Context ensures your event strategy is on point.
5. Food & Beverage: The High Revenue Trap
Your hotel’s restaurant just posted a 15% revenue increase. On paper, that looks like growth. It may not be as simple as that though.
If most of that increase came from all-inclusive covers or group business with lower per-person spend, profitability might actually be down. À la carte diners often generate higher margins, even with fewer covers.
Also, what about cost of goods sold (COGS)? If expenses climbed disproportionately, that revenue gain might be a red herring. Only by analyzing profit per cover and COGS can you determine if F&B growth is sustainable.
The lesson: Revenue is just one variable. Profitability per cover, sales mix, and COGS are the real performance indicators. Context keeps F&B strategies grounded.
6. Benchmarking: Seeing Your Performance Through the Right Lens
Imagine your hotel recorded a 10% RevPAR increase compared to last year. That sounds like progress. But if your competitors group their RevPAR by 15% that double-digit gain doesn’t feel so strong anymore.
Benchmarking brings crucial external context. Without it, you risk celebrating growth while actually falling behind. The market might be surging and you’re underperforming, or vice versa: a flat performance in a declining market might actually be a win.
Competitor set performance helps clarify whether your pricing, distribution, and demand strategies are actually working. Are you gaining market share? Are you growing at the same pace as the comp set? Without those insights, it’s easy to misinterpret the numbers.
Even simple metrics like occupancy and ADR take on new meaning when layered against STR or other benchmarking data. You might have high occupancy, but if your rates are trailing the market, you could be leaving money on the table. Alternatively, you might have a higher ADR but lower occupancy because your positioning isn’t aligned with market demand.
The lesson: Benchmarking isn’t optional. It’s the lens that shows whether performance is good, bad, or just average. Internal growth only tells half the story. Context, in this case, comes from looking outward.
The Broader Message: Analytics Without Context Are Dangerous
Analytics are supposed to guide better decision-making, but when we rely on single metrics without context, we risk making decisions that are reactive, short-sighted, or plain wrong.
Hotel performance isn’t just about “up” or “down.” It’s about understanding the why behind the numbers. That means layering internal and external data, comparing against market benchmarks, adjusting for timing shifts, and always questioning the surface-level view.
When context is missing, we end up chasing vanity metrics. When context is present, we focus on strategy, profitability, and long-term value.
How Hotels Can Embed Context into Analytics
- Adopt Net Metrics: Use Net ADR, Net Revenue, and Net Profit instead of gross figures to get a clearer picture of profitability.
- Integrate External Data: Benchmark internal performance against the market to understand competitive position.
- Use Smart Time Dimensions: Analyze trends using flexible booking, stay, and comparison periods. Static comparisons limit insights.
- Dissect the Mix: Always break down revenue and performance by channel, segment, room type, and more. The mix tells the real story.
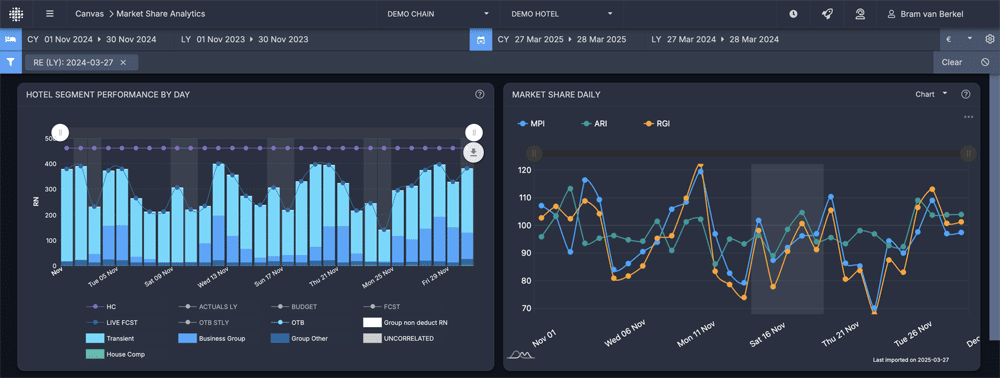
- Visualize with Purpose: Dashboards should offer layered views and allow users to explore underlying trends easily. One number on a screen is not enough.
The next time a report lands in your inbox with numbers that seem too good (or too bad) to be true, pause and ask yourself: What’s the context? Dig deeper and question the trend. Compare the data from multiple angles. Add external benchmarks. And most importantly, align your metrics with your business goals. Because in analytics, context isn’t just important: it’s everything.
Free Checklist: Start Using Data in Your Hotel’s Decision-Making
Using data to power insights and decisions at your Hotel can position you for commercial success, help increase guest satisfaction, and reduce costs. This checklist provides a starting point for hoteliers new to data analytics in the hotel industry.
Click here to download the checklist “Start Using Data in Your Hotel’s Decision-Making“.
More Tips to Grow Your Business
Revfine.com is the leading knowledge platform for the hospitality and travel industry. Professionals use our insights, strategies, and actionable tips to get inspired, optimize revenue, innovate processes, and improve customer experience.Explore expert advice on management, marketing, revenue management, operations, software, and technology in our dedicated Hotel, Hospitality, and Travel & Tourism categories.


Leave A Comment